Estimated Reading Time: 3 minutes
Big Fancy models have set the bar high, but guess what? My model is taking a different route by mastering the art of improvement on every forward and backward pass! Let’s explore the numbers that prove this learning leap. (P.S. If you’re new here, check out my previous posts for a quick refresher on model training!)
When dissecting neural networks, peeking into the weight matrices across layers is like decoding a secret language. The key? Spectral Norm, Weighted Alpha, Log Norm and Power Law Exponent — the powerhouse metrics that help us understand how well a model generalizes. These insights aren’t just fancy math, they help fine-tune architectures, optimize regularization, and tweak training strategies for better results. So, buckle up — we’re about to turn numbers into knowledge and make our models slightly! 🚀🔍
Details of My Model
A 124,475,904 parameter model, trained on 30 billion tokens using distributed training across 8× A100 GPUs for approximately 7 hours, all for just $80! 🚀
Model Analysis
After crunching through 30 billion tokens in ~58000 steps, the model isn’t just flexing - it’s actually getting smarter! 🚀 The generated tokens are looking sharper, but the real magic lies deeper. To truly measure success, we need to peek under the hood and analyze the model’s weights — the neural network’s brain synapses. After all, a model is only as good as the connections it makes! 🧠✨
First step is to look at the evaluation outcome,
- The “msgpt (124M)” model is learning effectively, with both loss reduction and accuracy improvement over training steps.
- It is outperforming GPT-2 (124M) in terms of loss and accuracy.
- It is still behind GPT-3 (124M) but showing good progression.
- The plots indicate that further training might further close the gap with stronger models.
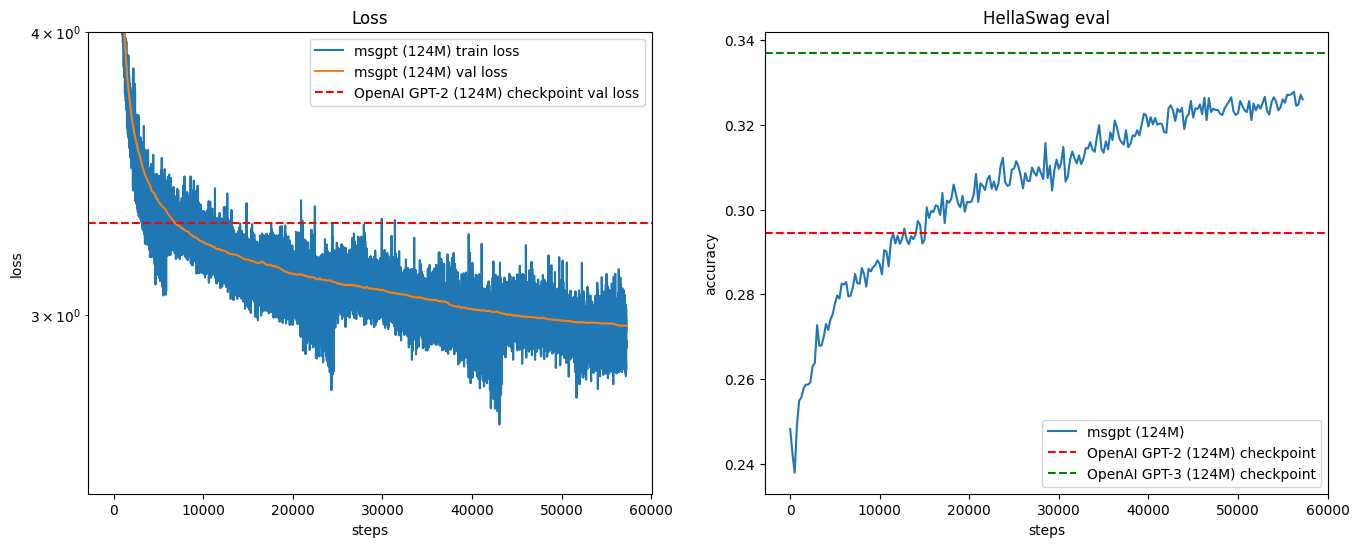
The model is learning well and has room for more improvements to match bigger models.
Now, let’s check out Spectral Norm, Weighted Alpha, Log Norm, and Power Law Exponent across the layers!
Spectral Norm Across Layers
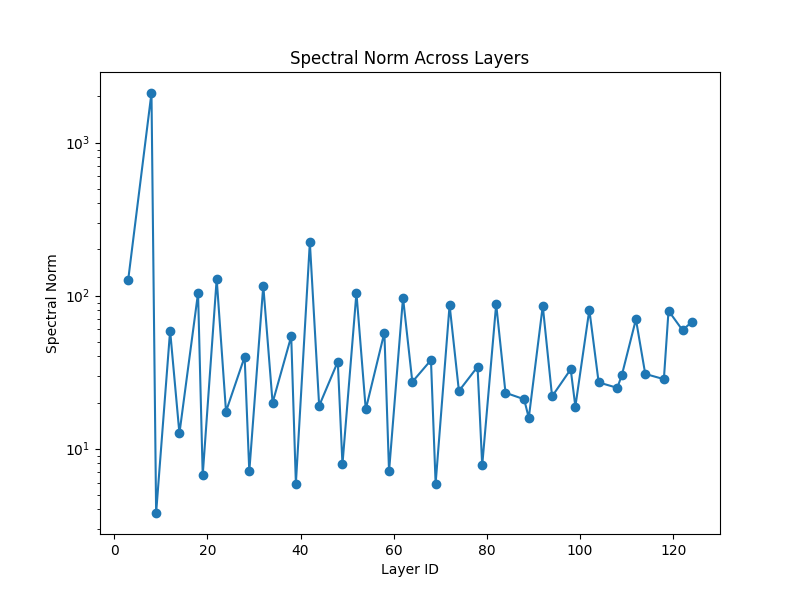
What is Spectral Norm? Spectral norm refers to the largest singular value of a weight matrix. It is a measure of how much a matrix can amplify input signals.
Interpretation:
- A high spectral norm in early layers (as seen in the first few layers) suggests strong feature extraction.
- Large variations across layers indicate differences in learning capacity, with some layers contributing more than others.
- A high spectral norm may also indicate potential overfitting, where certain layers are too dominant.
- If the spectral norm is consistently low, it may indicate underfitting or weak information propagation.
Takeaway: Monitoring spectral norms helps in understanding layer-wise significance and whether regularization techniques, like weight normalization, should be applied.
Weighted Alpha Across Layers
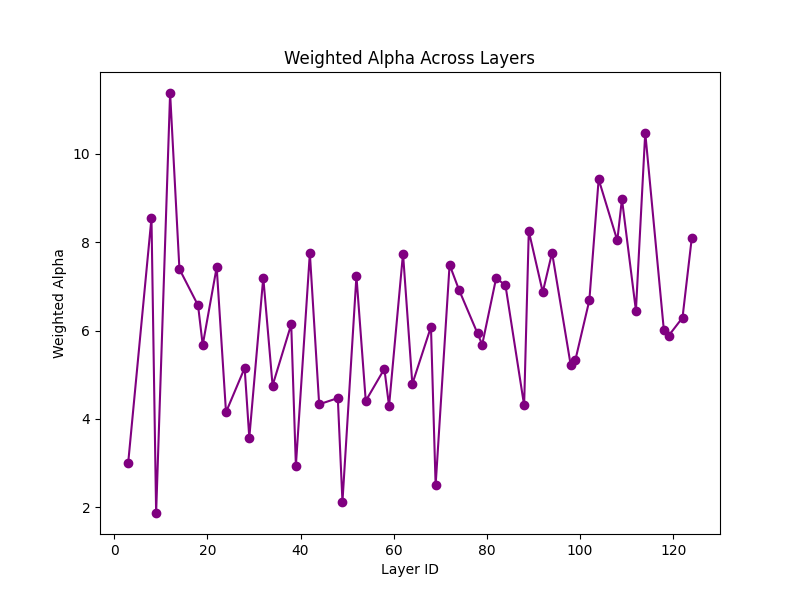
What is Weighted Alpha? Weighted Alpha (α) comes from Power Law analysis of eigenvalues of weight matrices. It reflects the degree of correlation between weight matrix elements.
Interpretation:
- Lower values (~2-4) indicate well-trained layers with good generalization.
- Higher values (~8-10) may indicate over-parameterization and a risk of overfitting.
- If Alpha increases towards the final layers, it suggests that later layers contribute more towards memorization rather than generalization.
- A stable Alpha distribution suggests a well-conditioned model, whereas highly fluctuating values might indicate learning instability.
Takeaway: Weighted Alpha provides insights into model generalization, and adjustments in architecture or regularization strategies can be made based on its trends.
Log Norm Across Layers
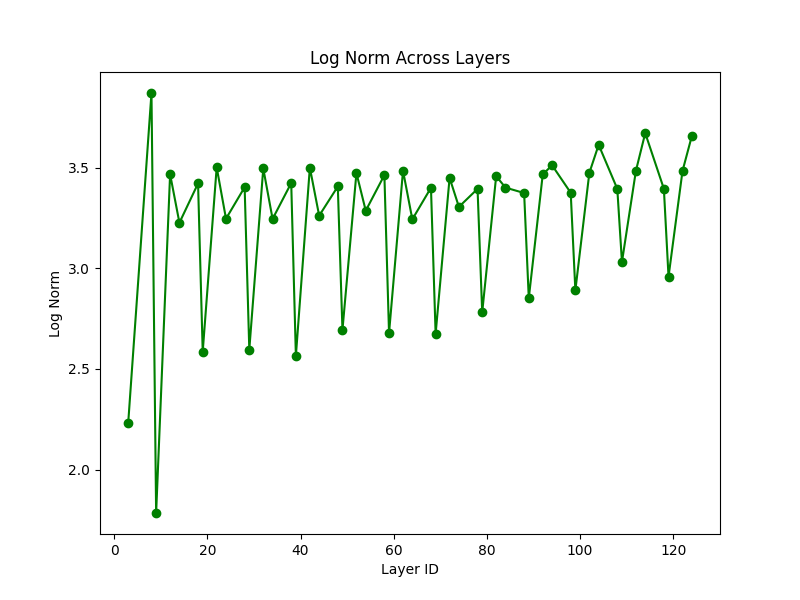
What is Log Norm? Log Norm measures the logarithm of spectral norms across layers, providing a smooth trend for better interpretability.
Interpretation:
- An increasing trend in log norm suggests progressive learning across layers, with deeper layers contributing more.
- If log norm fluctuates significantly, it might indicate irregular weight distribution and potential training instability.
- Consistently high values indicate a strong model but also might lead to exploding gradients if unchecked.
- Lower values suggest lower complexity, potentially indicating underfitting.
Takeaway: Log Norm trends provide a holistic view of how well the network is structured and trained, offering insights into stability and learning dynamics.
Power-Law Exponent Across Layers
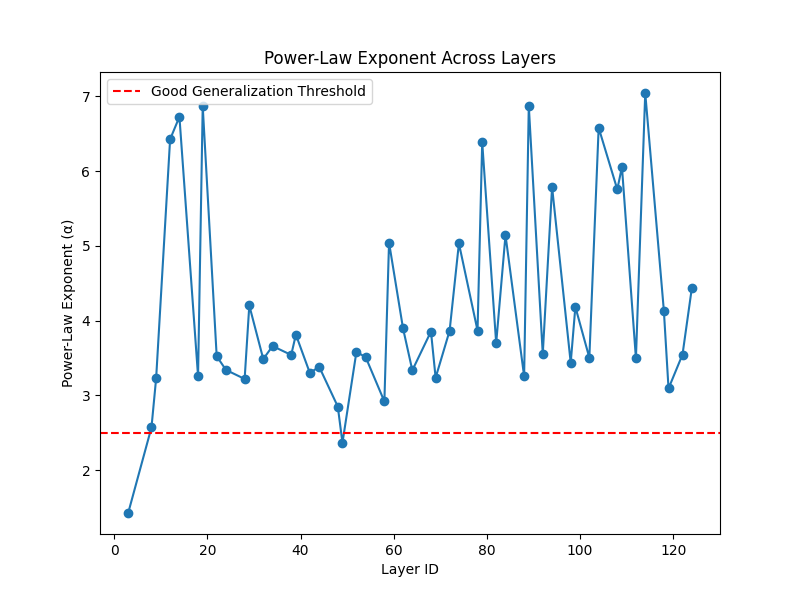
What is Power-Law Exponent (Alpha)? The Power-Law Exponent (α) is derived from the spectral distribution of weight matrices and is a crucial indicator of model complexity and generalization.
Interpretation:
- α < 2.5: Indicates a well-regularized model that generalizes well.
- α between 2.5 and 4: Suggests moderate generalization.
- α > 4: Indicates overfitting, meaning the model might be too complex and prone to memorization.
- The red dashed line in the graph represents the threshold for good generalization.
- Layers with significantly higher α values should be monitored for overfitting tendencies.
Takeaway: By tracking the Power-Law Exponent, we can assess whether a model is likely to generalize well or if it is overfitting, helping in designing more robust neural networks.
Acknowledgments
This learning journey has been shaped by the incredible contributions of the deep learning community. A special thanks to fast.ai for making AI more accessible, the groundbreaking paper “Attention Is All You Need” by Vaswani et al., and the insightful work of Andrej Karpathy, whose contributions to neural networks continue to inspire me.
A huge shoutout to Lambda Cloud’s GPU instances—my go-to training environment for powerful and efficient computing. Lastly, WeightWatcher deserves credit for its invaluable role in model diagnosis and analysis. 🚀🔥
All these contributions have enriched my learning experience, that’s all that matters!